Perceptron Learning Algorithm
This note illustrates the use of perceptron learning algorithm to identify the discriminant function with weight to partition the linearly separable data step-by-step. The material mainly outlined in Kröse et al. [1] work, and the example is from the Janecek’s [2] slides.
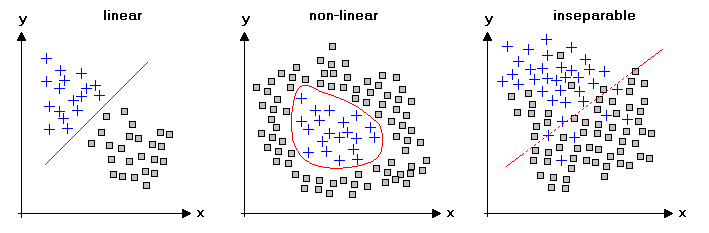
In machine learning, the perceptron is an supervised learning algorithm used as a binary classifier, which is used to identify whether a input data belongs to a specific group (class) or not. Note that the convergence of the perceptron is only guaranteed if the two classes are linearly separable, otherwise the perceptron will update the weights continuously.
Structure of Measured Data by H.Lohninger from Teach/Me Data Analysis
Perceptron
The perceptron is a single layer feed-forward neural network that the inputs are fed directly to the outputs with a series of weights. In the following figure, the simplest kind of neural network which consists of two inputs $x_1, x_2$ and a single output $y$.
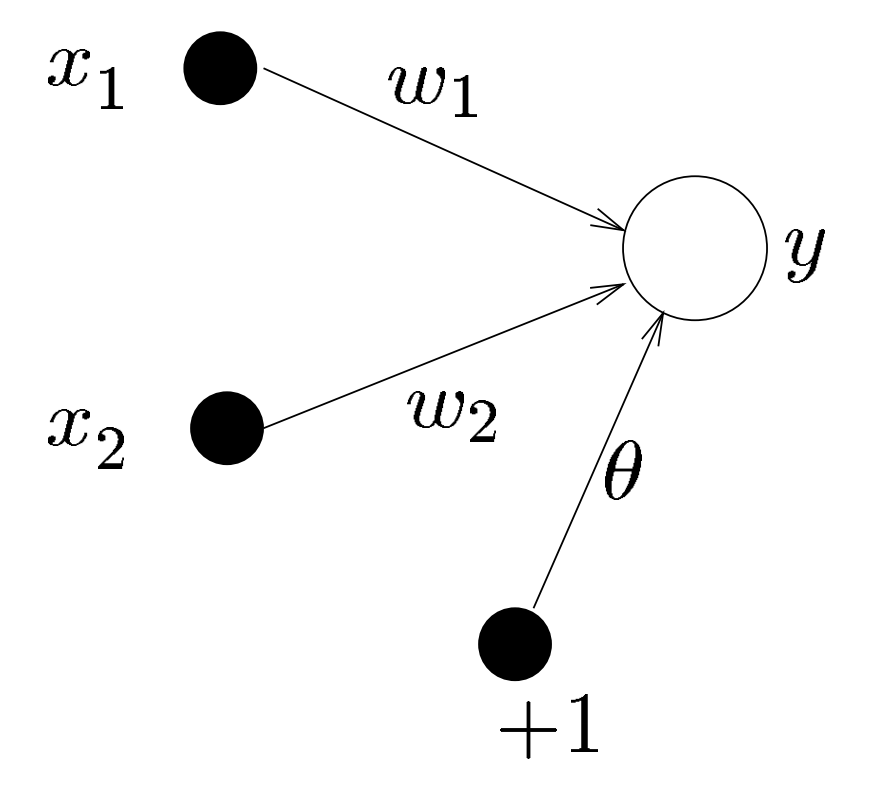
Single layer network with one output and two inputs [1]
The sum of the products of the weights and the inputs plus the bias is the input to the neuron:
$$ y = \mathcal{F} \left( \sum_{i=1}^{2} w_i x_i + \theta \right)$$
If the output value of activation function $ \mathcal{F} $ is above some threshold such as 0, then the neuron fires and the activated value is 1 in our example; otherwise the value will be -1 for the deactivated value. The simple network can now be used for a classification task with linearly separable data.
The line to separate the two classes is given by the below equation:
$$ w_1x_1 + w_2x_2 + \theta = 0 $$
Perceptron Learning Algorithm
First of all, we assumed that the data set consisted of two linearly separable classes $ A $ and $ B $; let $ d(n) $ be the desired output for each class [2]:
the network output is the dot product [10] of two vectors $ (w, x) $ could be calculated as below, where $ w^T $ is the row vector obtained by transposing $ w $ :
We know the value of $ \cos(\theta) $ is positive with the $ \theta $ between $ 0 $ and $ 90 $ degrees, and negative between $ 90 $ and $ 180 $ degrees. Hence we can measure the angle between vectors, i.e., $ \theta $, to adjust the weights to the right direction if we met the wrong classification [9].
Cosine Degrees from Cosine of 90 degrees
the data set is regarded as the training data to train the perceptron, and let $ w_0 = \theta $ and $ x_0 = 1 $ for convenience in the illustration. In addition, introducing the learning rate $ \eta $, which is a sufficient small positive number to avoid causing drastic changes to classification performance. So we do nothing if the perceptron responds correctly, otherwise we update the weight vector by:
$$ w_i = w_i + \eta d(n) x_i (n) $$
repeat the above procedure until the entire input data is classified correctly.
Perceptron Learning Example
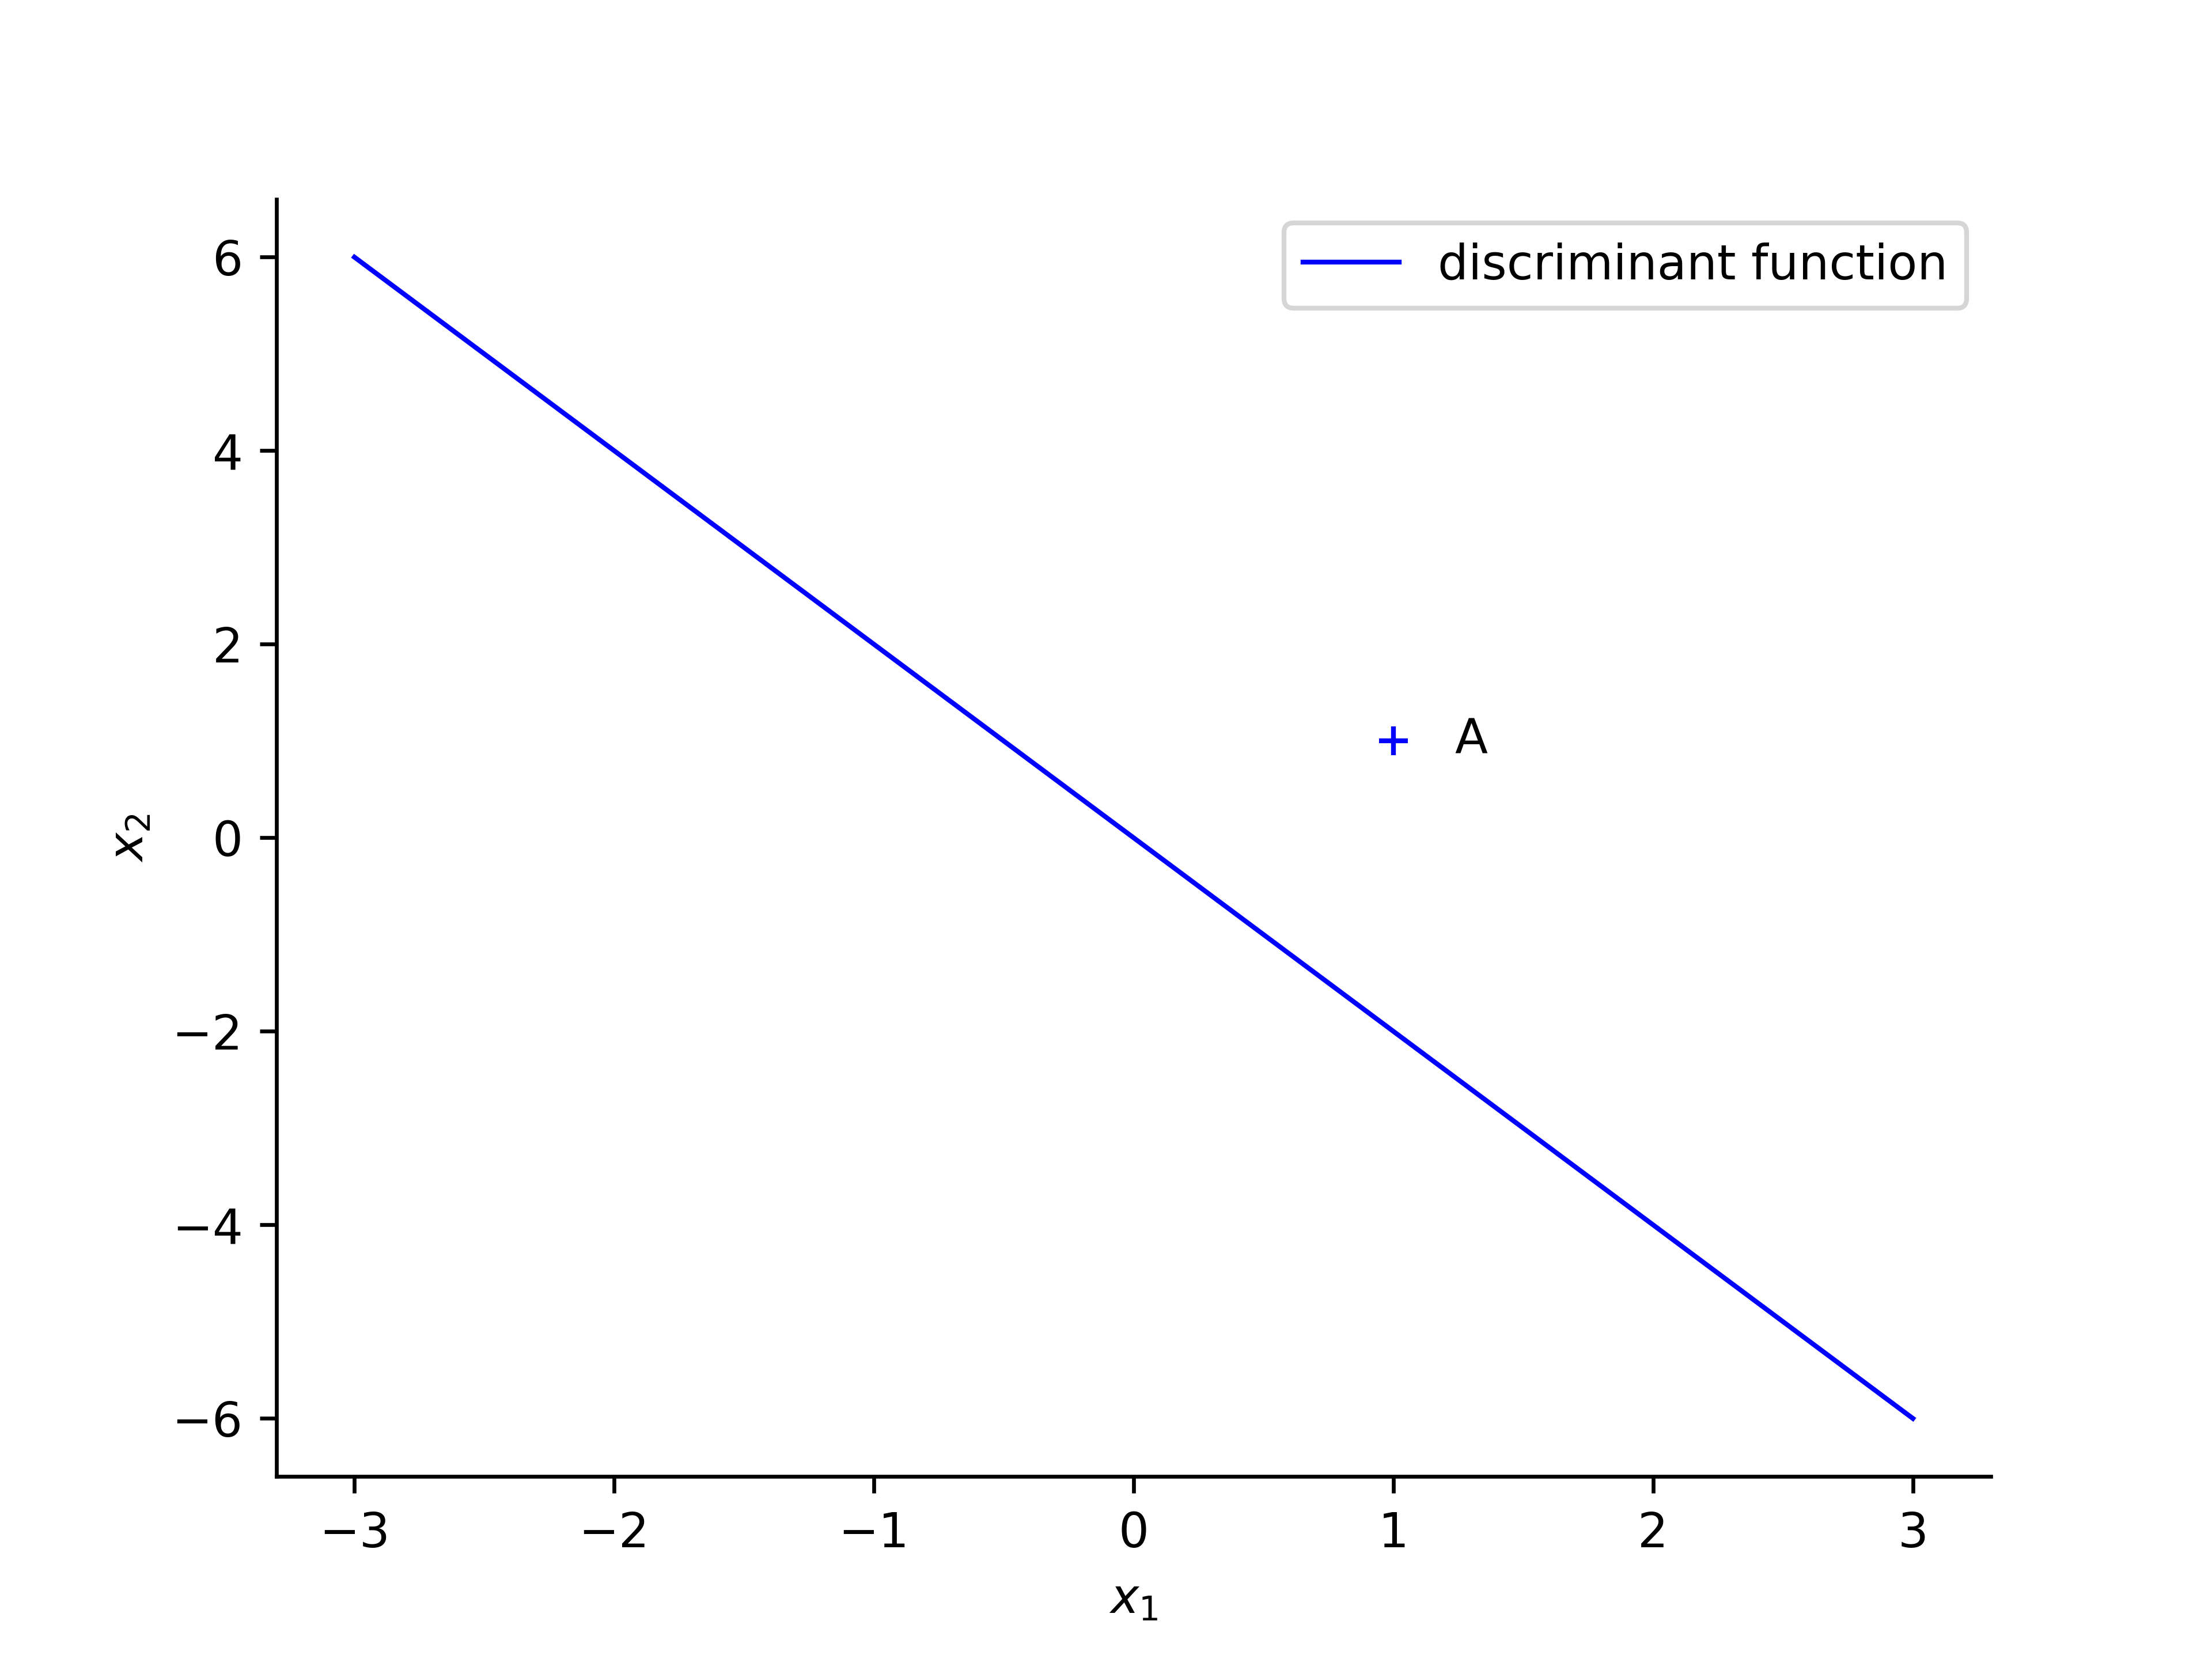
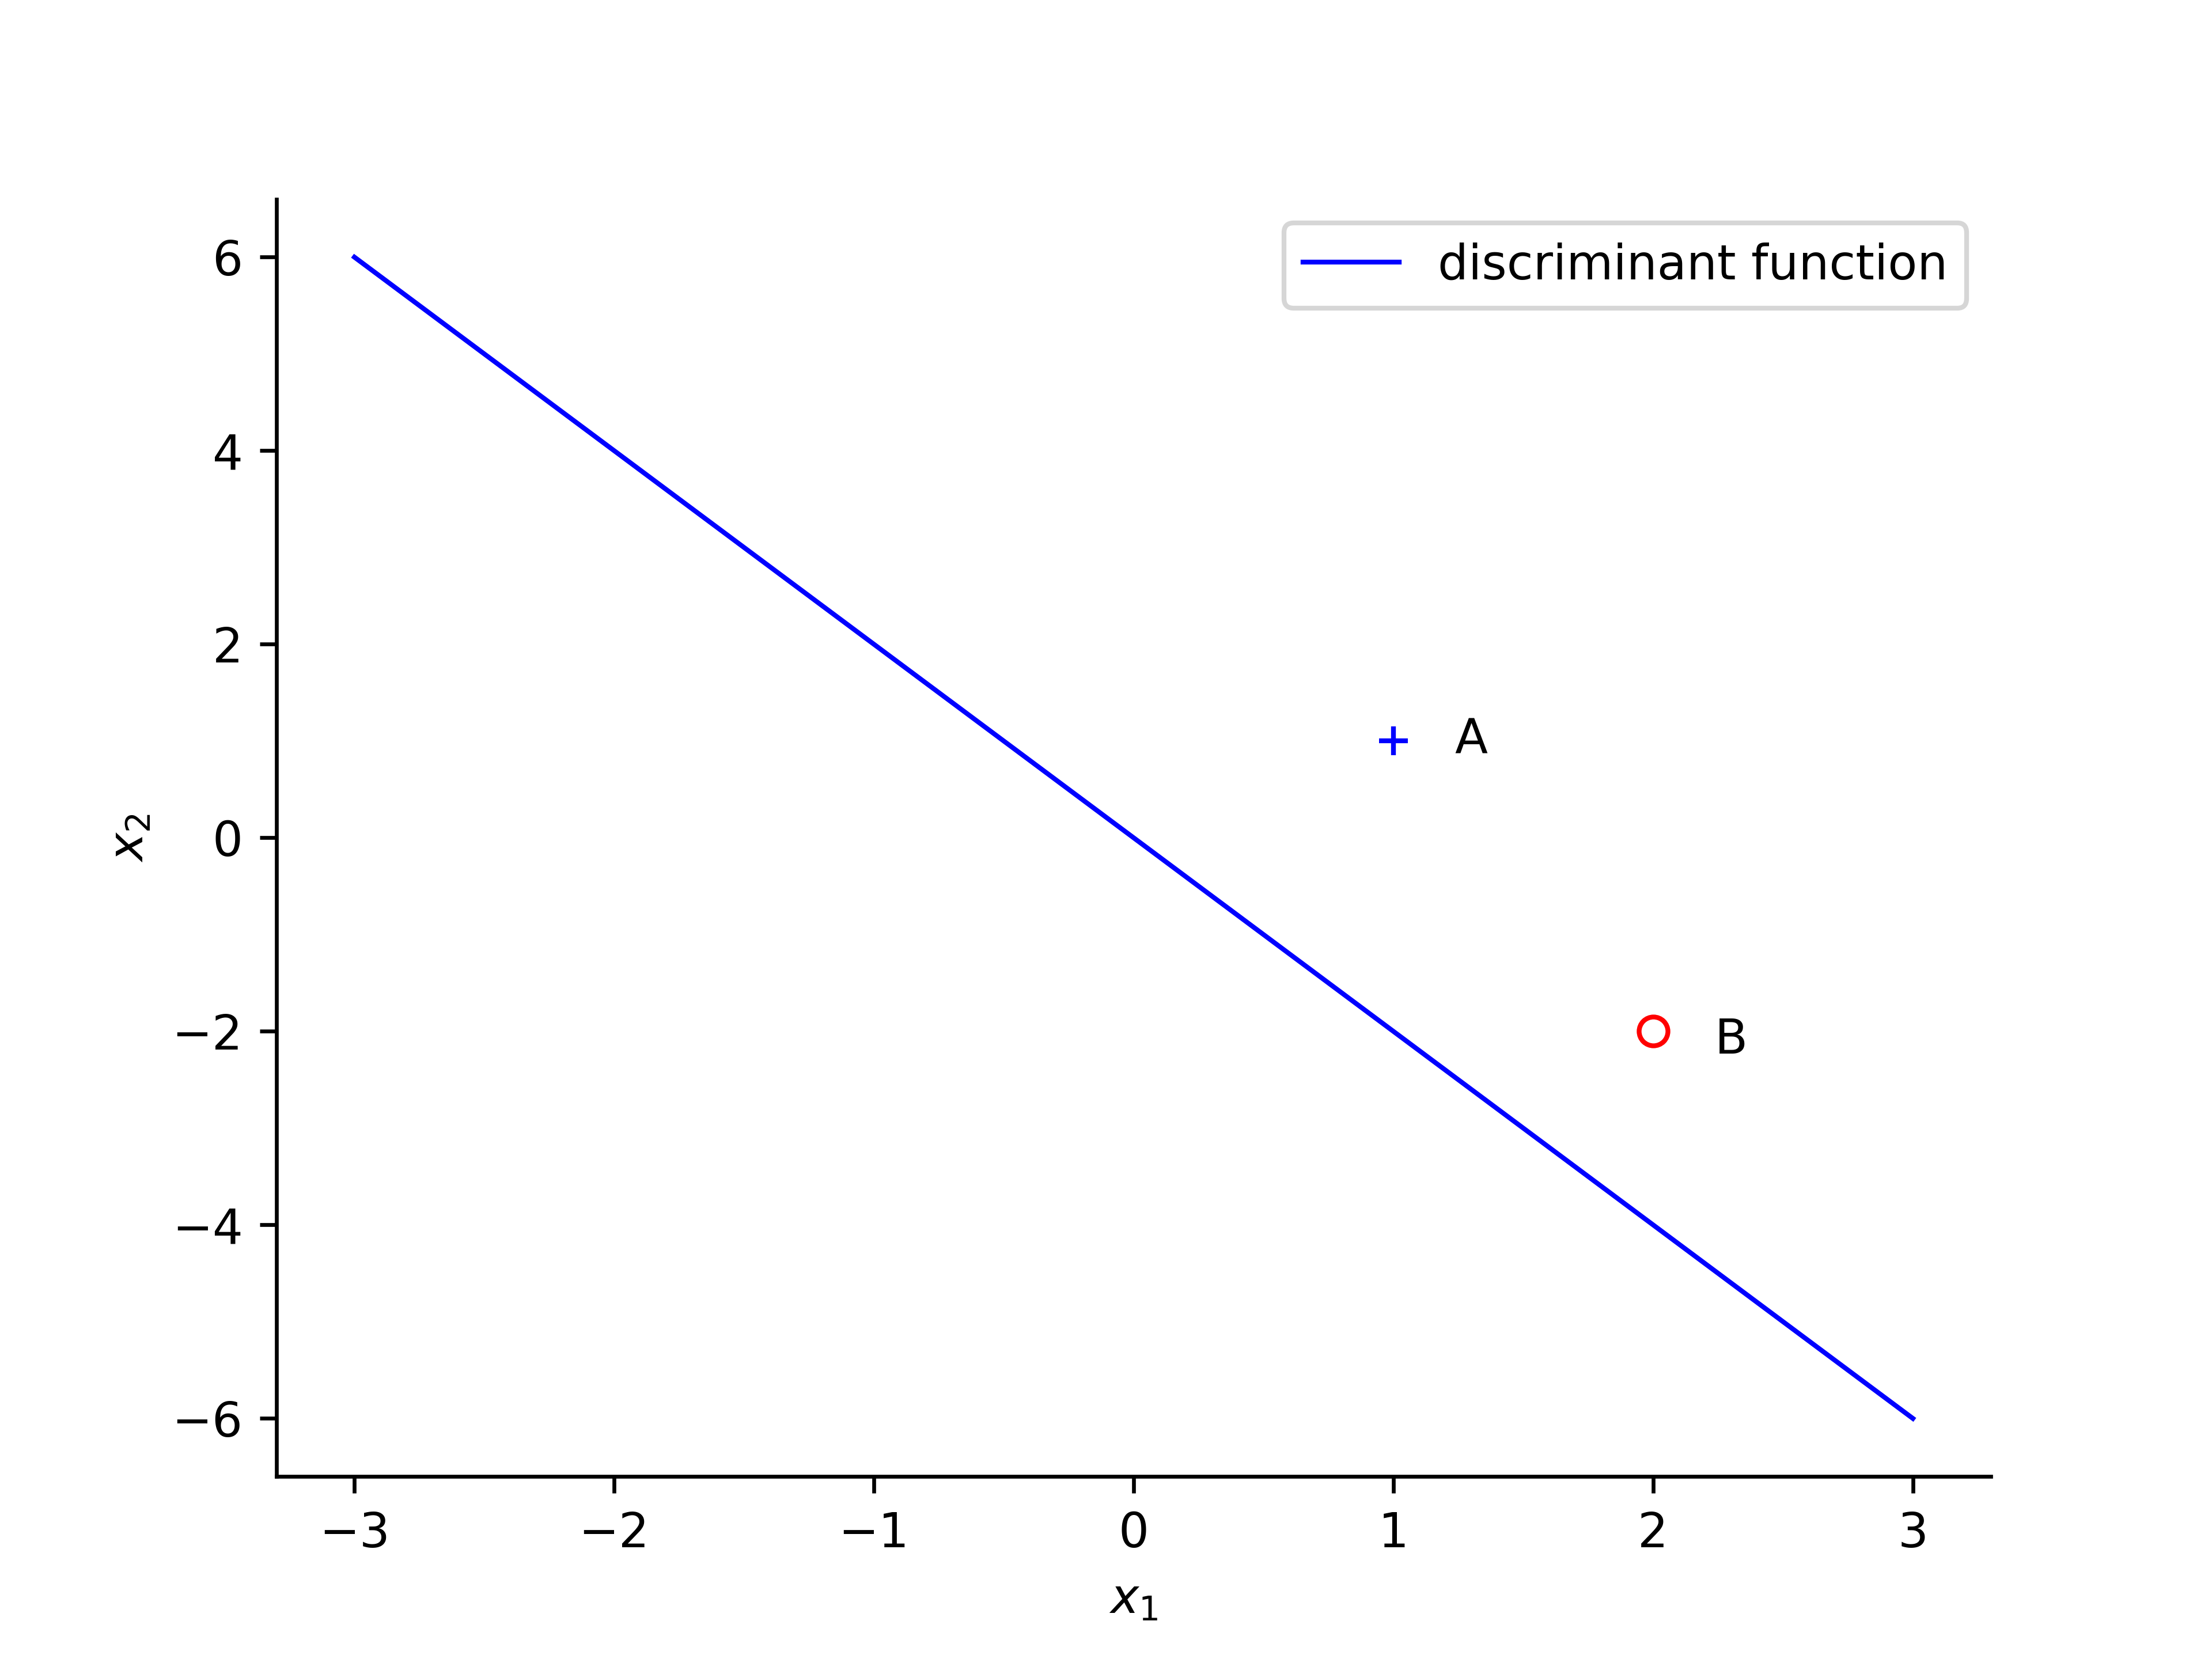
Following example is based on [2], just add more details and illustrated the change of decision boundary line. A perceptron is initialized with the following values: $ \eta = 0.2 $ and weight vector $ w = (0, 1, 0.5)$. The discriminant function can be calculated: $$ 0 = w_0x_0 + w_1x_1 + w_2x_2 = 0 + x_1 + 0.5x_2 $$ $$ \Rightarrow x_2 = -2 x_1 $$
the first sample $ A $, with values $ x_1 = 1 , x_2 = 1 $ and desired output is $ d(n) = + 1$, the $ w^Tx > 0 $, so that the classification of A is correct and thus no change required.
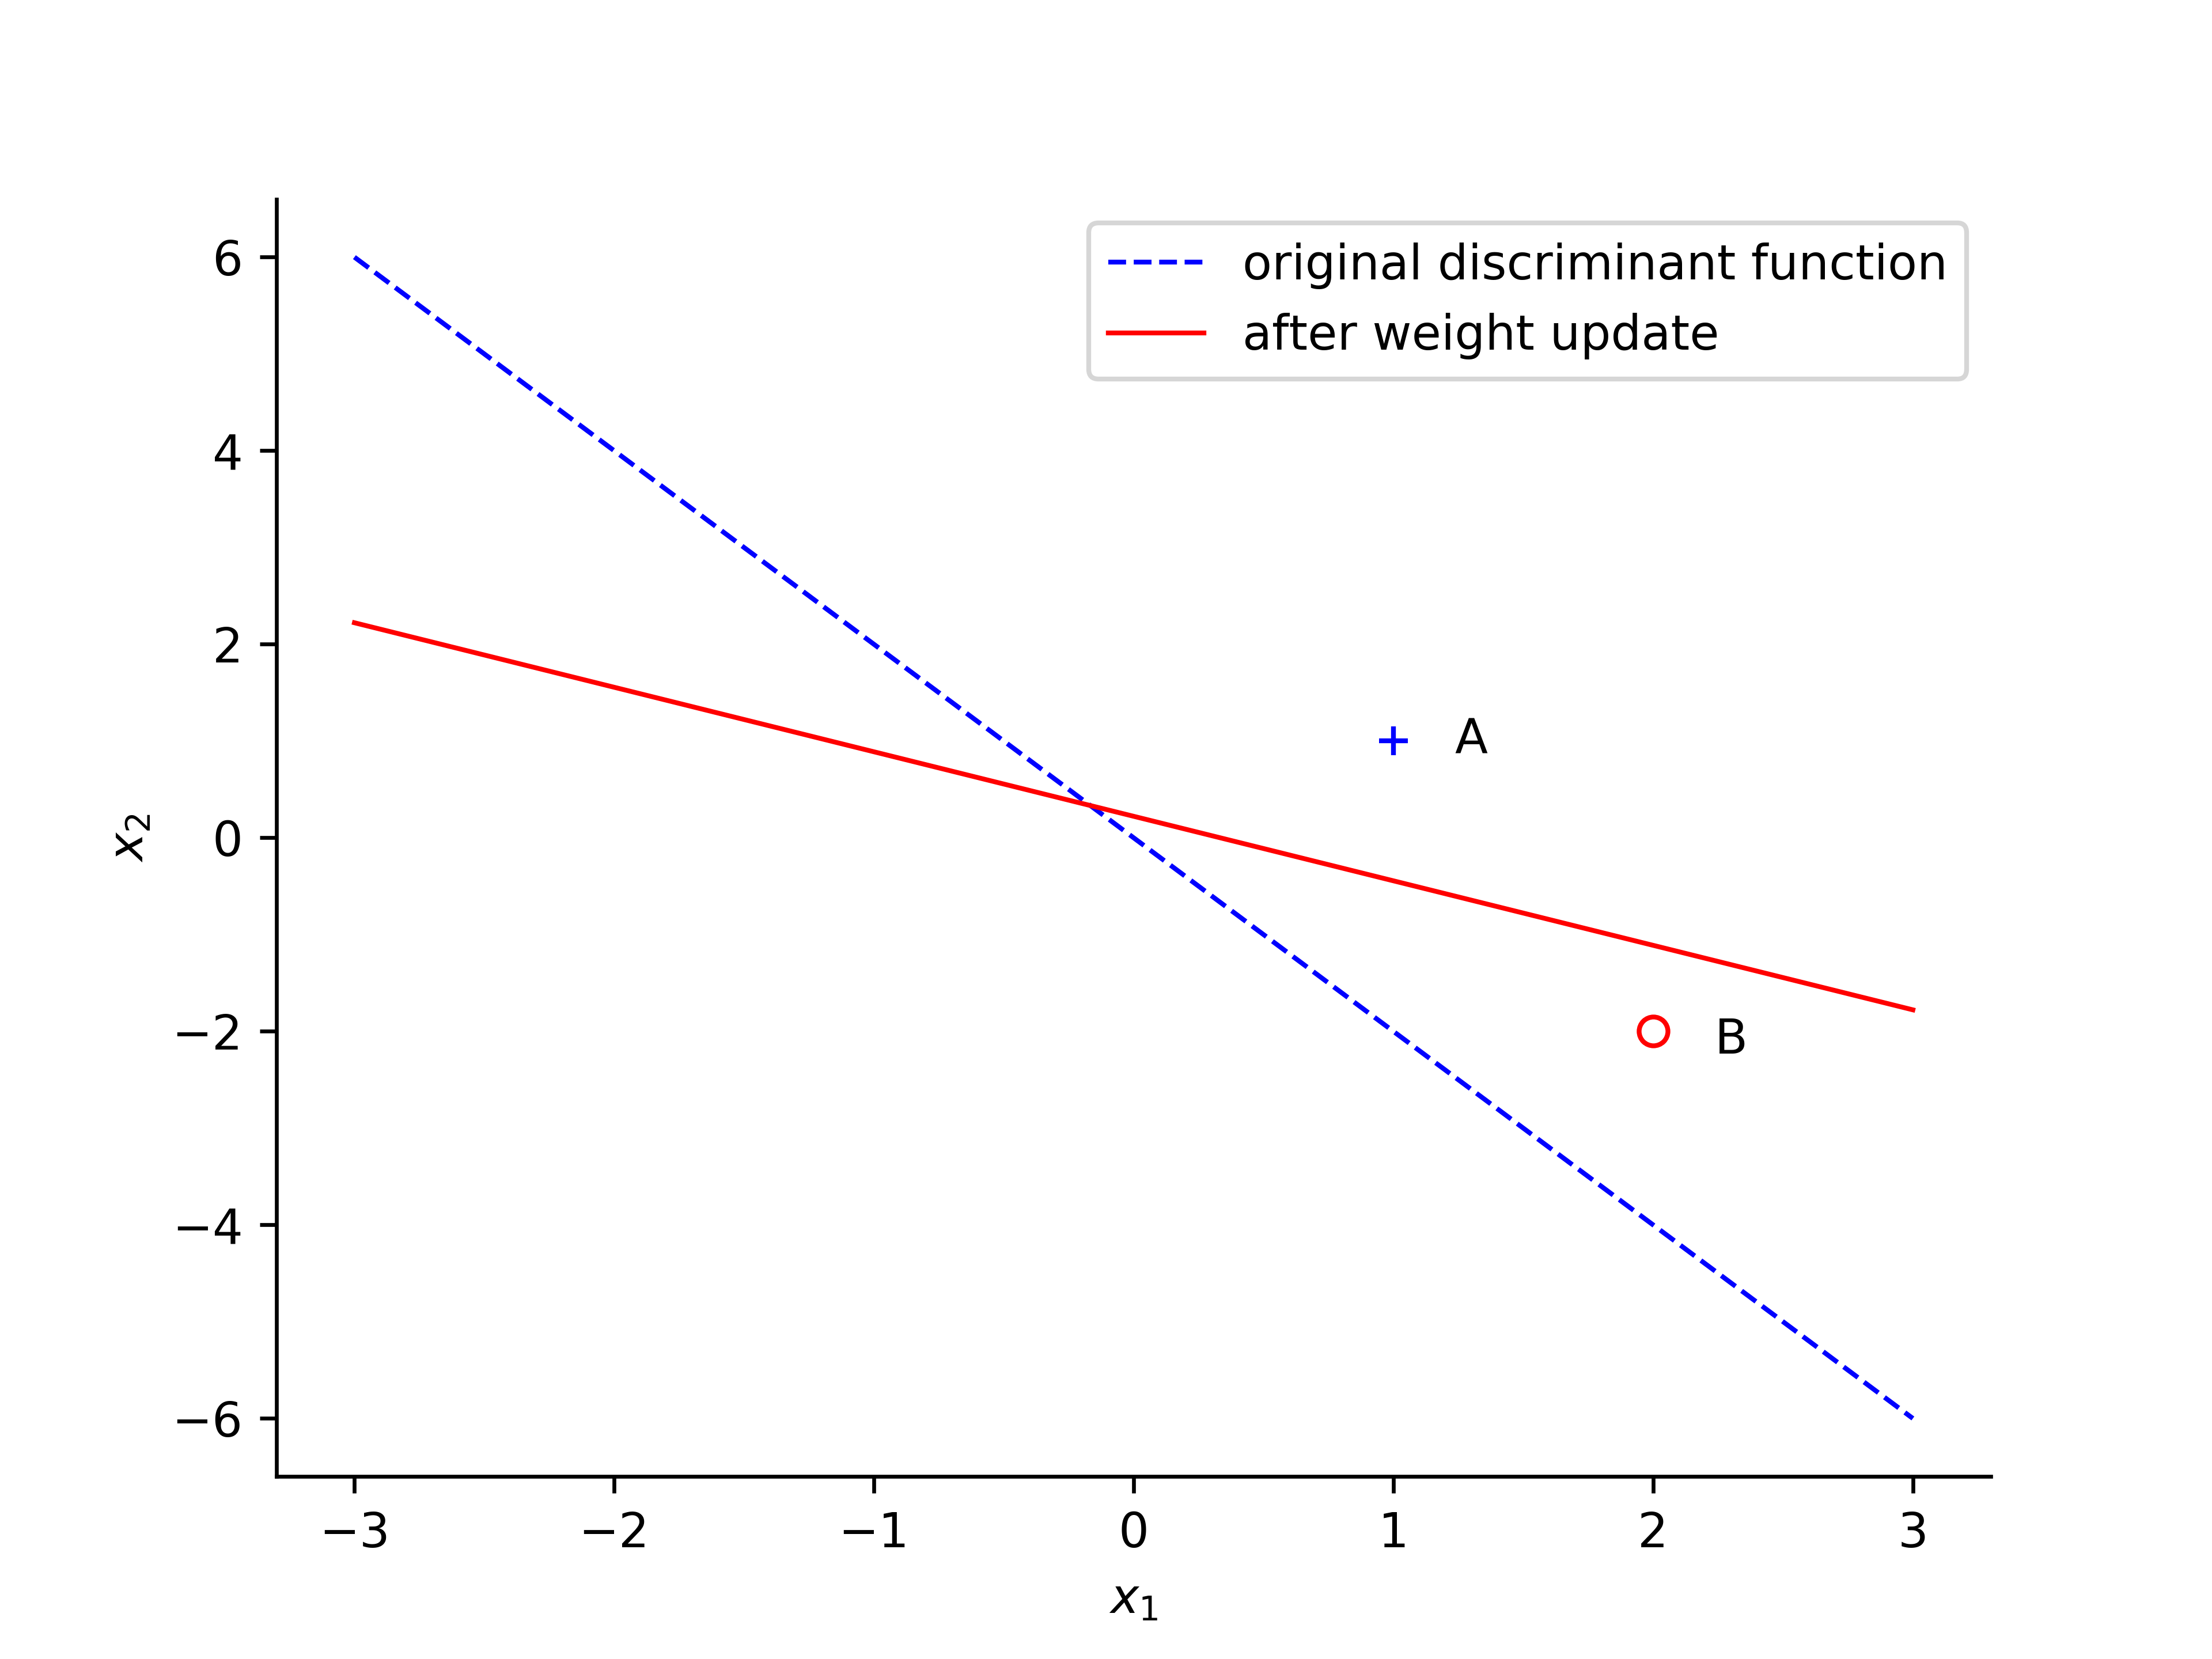
When revealing point $ B $ with values $ x_1 = 2 , x_2 = -2 $ the network output $ +1 $, while the target value $ d(n) = -1$. The weight will be updated when the classification is incorrect.
The below diagram shows the original discriminant function and after the weight updated.
For further implementations, please check the previous works [4-7] to have more details about how to apply the above learning algorithm on Iris data set.
Video Resources
References
- Ben Kröse and Patrick van der Smagt, An Introduction to Neural Networks, 1996.
- Jakob Janecek, The Simple Perceptron, Feb 1, 2007.
- Akshay Chandra Lagandula, Perceptron Learning Algorithm: A Graphical Explanation Of Why It Works, Aug 23, 2018.
- Yeh James, [資料分析&機器學習] 第3.2講:線性分類-感知器(Perceptron) 介紹
- kindresh, Perceptron Learning Algorithm
- Sebastian Raschka, Single-Layer Neural Networks and Gradient Descent
- Brian Faure , Single-Layer Perceptron: Background & Python Code
- The Perceptron Algorithm
- Rhadow’s Tech Note - 機器學習基石-第二講筆記
- Dot product